
Because we sell support contracts where we are responsible for our customers’ websites, it is important for us to be able to stay ahead of the game at all times, ideally to the level where we can work proactively and prevent serious errors – before they occur. If something happens to our customers’ websites, we are expected to be able to respond to why something has happened, and make sure it doesn’t happen again.
There are many reasons why things can happen. We often take over responsibility for other people’s websites and these can have a lot of quality issues. A highly authorised administrator may have accidentally clicked the wrong button and made a major change. Another not too uncommon scenario is that the site is built around ready-made plugins that after some time encounter compatibility issues with newer versions of WordPress. In some cases, we’ve even seen developers remove functionality from their plugins – which can leave an administrator unable to fulfil their role.
For an organisation that has invested heavily in its website, it is therefore important that the site is tested and monitored carefully. To be sure that the functionality works, you need a variety of tools. In this article, I will talk about one of the tools we use to make sure things are working – log monitoring.
What is log monitoring?
Log monitoring as we use it means that we continuously import as many log events as possible from our customers’ servers on an ongoing basis using a tool called Splunk. A pure instance of Splunk contains only raw data, but using Splunk’s interface and scripting language, we can search for certain types of events. We can then visualise these events in a variety of ways to create a tailored dashboard that displays relevant information for our purposes.
Doing a search is very simple and intuitive, and with a few point-and-click manoeuvres you have constructed a small widget of your search. You can then drag your widgets around your dashboard easily with simple drag and drop. There is also a great feature to smoothly and with point-and-click let the software produce complex regular expressions to extract specific data from a complex data set.
What can you display?
Splunk helps us display information about each server – disc size, processing power, processes & users without having to make any special settings. By retrieving log files, we can also get a lot of relevant information that tells us important things about the quality of the customer’s website, such as serious errors in code, bruteforce attacks, incorrect permissions, etc. It can even predict trends. What Splunk doesn’t do directly is show WordPress-specific information that might be relevant to us. Since we don’t want to turn on debug mode in a production environment for performance reasons, there is no log data available. We therefore have to tell WordPress ourselves that – and what – it should log. We do this by using various extensions.
Show login attempts with WP fail2ban
A first step that can be useful is to use fail2ban together with WP fail2ban. This means that all logins made to WordPress are automatically logged in syslog (and thus in Splunk).
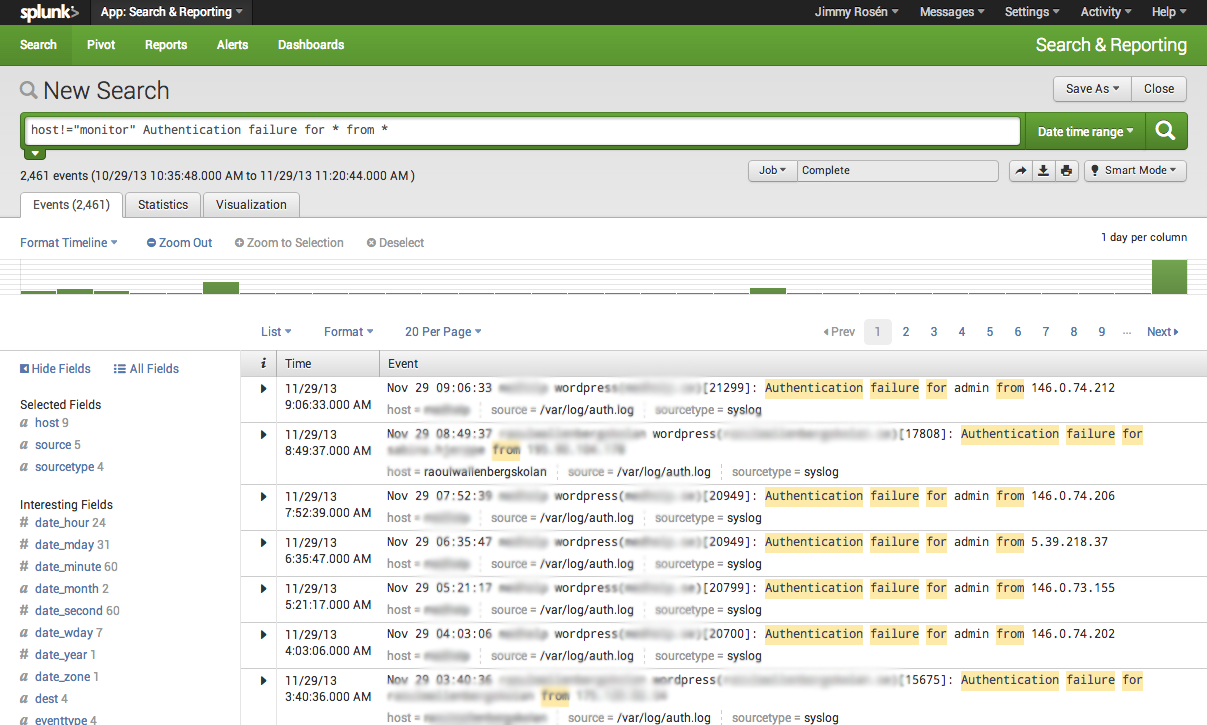
Using the data we get to Splunk from WP fail2ban, we can now do a simple search to get all failed login attempts:
Authentication failure for * from *
This probably shows a long line of raw data. This is a bit difficult to get an overview of, as we have many customers. Therefore, we want to turn this into a curve that shows the trend over time. In this curve, we ideally want each machine to have its own bar. By making some additions to our search, we can make Splunk do the search so it shows change over time.
Authentication failure for * from * | timechart count by host
This visualisation, translated in dashboard widgets, gives us something like this:
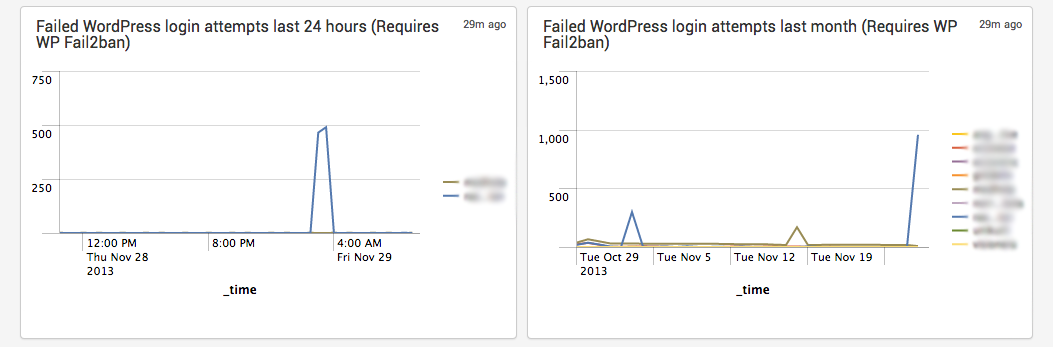
This visualisation allowed us to easily turn the “spike” seen in the statistics into a case: tweak the fail2ban settings a bit to reduce the number of bruteforce attempts that are not stopped by the installation firewall (which is then automatically applied to WordPress as well)
Show potential issues with Angry Creative Inspector
We’ve made our own add-on (which is currently an Alpha/Beta) Angry Creative Inspector, which tells Splunk things that we know from experience can be important.
We’ve sorted things into three kinds of categories:
- Notice
- Warning
- Error
A Notice is something that is not a danger – you can look at this when you have time. A Warning is something that you probably want to fix pretty soon. An Error message is something you want to look at immediately.
Currently, the AC Inspector is able to report the following events:
- Multisite compatible
- Site activation/deactivation (Multisite)
- Plugin activation/deactivation
- File permissions (Plugins & Uploads)
- Check if production server has wrong constants (e.g. DISALLOW_FILE_MODS)
There is a lot to do here and we are happy to receive help to further develop the plugin. Some of our goals are:
- Clear consistent format of logs
- Sanity check file trees
- An administrator should be able to decide the log format himself
- An administrator should be able to create a list of critical plugins
- An administrator should be able to see in the logs if search engine indexing is blocked
So how do we use Angry Creative Inspector with Splunk? We simply search Splunk at its various log levels and visualise these in a dashboard. This is how we have chosen to do it, because a small error can trigger many Notice/Warning/Error messages. Our search then looks something like this:
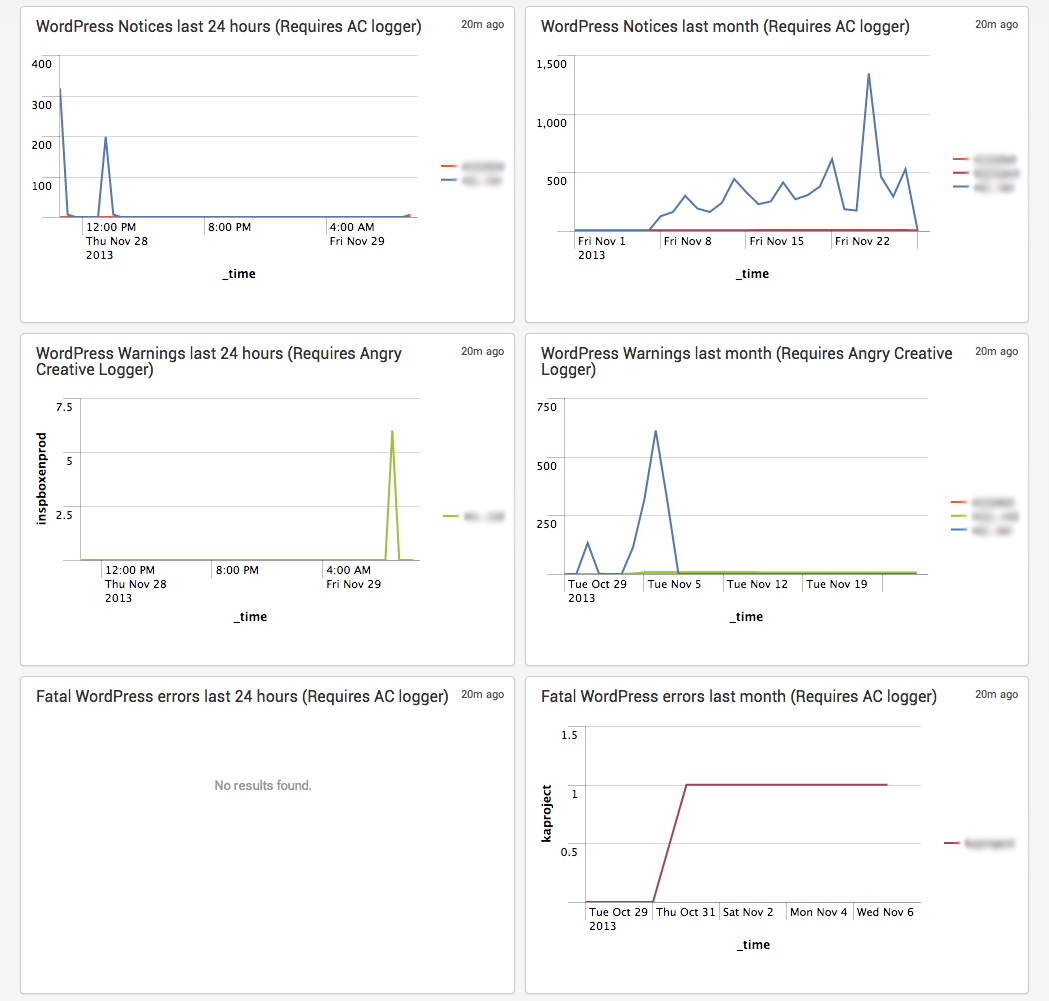
"[AC_Inspector]" "NOTICE" | timechart count by host
If we add that search and make some different types of date restrictions for, for example, the last 24 hours, we get a dashboard in Splunk where we can very quickly and easily see what is happening in our environment without having to dig very deeply into the logs. This means that our dashboard in Splunk might look something like this:
Conclusion
In conclusion, Splunk works as a great tool to quickly troubleshoot and fix issues that arise in our WordPress installations. Splunk solves the problem of HOW to do this well, and replaces it with a bigger challenge: knowing WHAT to look for and visualise.